Population Pyramid

|


|


|
Population pyramids show very well a country's place in the demographic transition model. This population pyramid helps confirm that Germany is around stage 4, approaching 5 withing the DTM. Since Germany is in this stage of the DTM, it will soon occur, and is already happening that the elderly population will be the largest group of people, and that there would be a very high dependency ratio, and very few working compared to the amount of elderly. When looking back in time at how Germany's population has changed throughout the last 75 years.
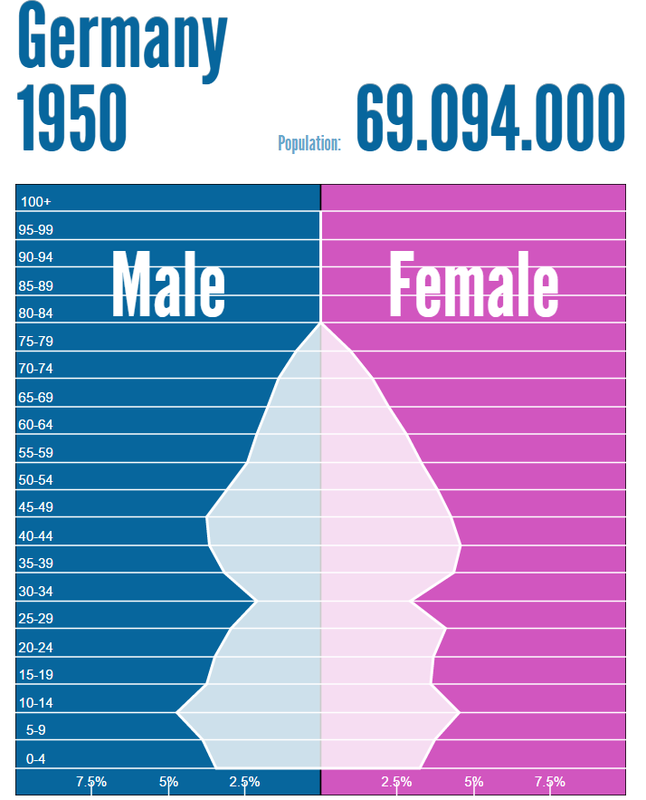
In 1950, the population was well developing, in stage 3 which is only starting to slow extreme growth, and there is a large gap between 25 - 34 for men and women, most likely because they were the ones who died in World War II. There is also an excess of population that are young. There is also 69 million people in Germany during this time.
In 1975, there is still a gap that is around age 50, still from those who fought in World War II, but weren't able to make it out. That bulge out from 1950 is still there, but 25 years progressed. There is also a small decrease is ages 20 - 29. It also appears that there is more female population than male population. Also, it appears that the population's life expectancy maxes out at 84 years of age. There is also an increase in population to just under 77 million people
In 2000, the population pyramid increase upward, and it appears that the life expectancy takes a jump upward, where some people are able to make it to 100 years old. There is also a bulge of middle-aged, working class people and a lower amount of younger population during this time. The population also had increased to 81.5 million people.
In 2015, the shape of the pyramid stays the same, except for some of the sharp edges are smoothed out as people die from natural causes. It is also clear to see that the birth rate is very low, and compared to the rest of the pyramid, it looks minuscule. Also, the population began to decrease slightly to 80.5 million.
In 2050, the population pyramid has predicted to be very skinny compared to the previous years, most likely due to the fact that it would probably be around stage 5 in the DTM. Since it would be in stage 5 at this time, the reason it would be so skinny and even would be because they would be very little to no growth within this time. Also, since the growth is either negative or very little, the population would probably suffer to around 74.5 million people.
In 2099, the population becomes continuing lower, to around 63 million, and the whole population pyramid becomes to look like an inverted pyramid because of the low natural increase rate. There would also most likely be a quick cut off at the end of the life expectancy, which would probably still be around 100.
